
Extrapolation
Predicting
the
future
is
always
difficult,
concerning
the
weather,
let
alone
the
climate,
but
people
have
always
leapt
to
completely
wrong
conclusions
when
there
has
been
a
short-term
trend.
These
have
all,
inevitably,
been
proven
to
be
wrong.
People
tend
to
apply
linear
or
geometric
extrapolation,
which
is
not
in
keeping
with
the
trends
of
nature.
If
there
has
been
a
period
of
rising
temperatures,
people
have
jumped
to
the
conclusion
that
this
trend
is
going
to
continue
to
disastrous
ends.
This
is
what is happening now with all the ‘Climate Crisis’ predictions.
The
fact
is,
that
the
climate
is
controlled
by
outside,
cyclic
parameters,
that
no-one
can
control.
These
have
been
known
about
for
many
years,
but
seem
to
have
been
forgotten
recently.
Now
the
thing
about
cyclic
functions
is
that
they
are
made
up
of
a
series
of
pure
sine
waves
which
each
carry
on
to
infinity.
This
means
that
if
you
can
identify
the
component
sine
waves,
you
can
add
them
all
together
in
the
right
amplitude
and
phase,
to
produce
a
replica
of
the
temperature
graph
for
the
last
120,000
years
or
more.
Furthermore,
this
graph
will
continue
into
the
future
and
will
give
a
very
good
idea
of
what will happen in years to come.
At
first
sight,
the
graph
looks
fairly
random,
but
to
someone
conversant
with
electronic
waveforms,
it
can
be
seen
that
such
a
graph
can
easily
be
constructed
using
many
sine
wave
components
at
different
frequencies,
phases
and
amplitudes.
Each
of
these
would
be
due
to
a
natural
set
of
cyclic
events, many of which are already known.
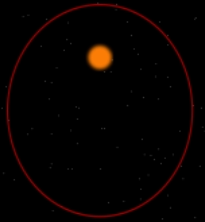
1.It
is
known
that
the
orbit
of
the
earth
changes
over
a
112,000-year
cycle.
This
is
approximately
the
duration of an ice age and one inter-glacial period. This is known as the Milankovitch Effect.
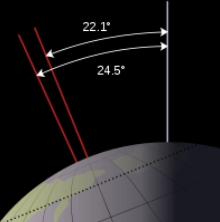
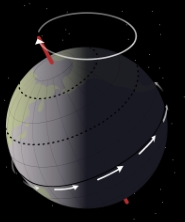
2.The axial tilt of the earth oscillates about a mean position over a period of 41,000 years.
3. Its tilt also precesses with a period of 26,000 years.
This
gives
us
3
main
sinusoidal
components
to
play
with,
however,
harmonics
of
these
components
also play a part and must be added in also.
If
we
can
generate
all
these
sinusoidal
components
so
that
the
fossil
record
graph
can
be
duplicated,
we
can
then
see
what
will
happen
in
the
future
as
these
cyclic
components
are
constant
and
will
continue into the future.
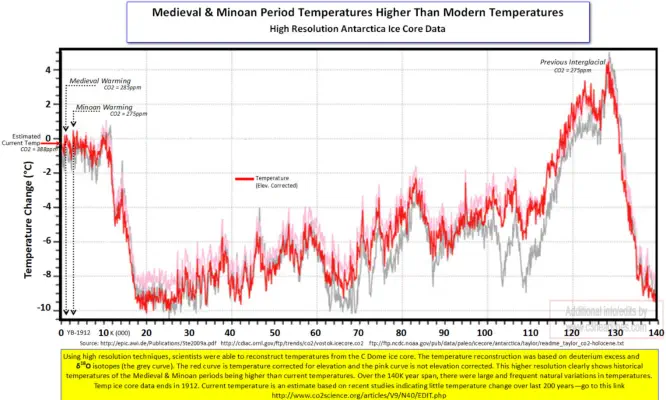
The
above
graph
is
the
fossil
record
of
world
temperature
that
has
been
extracted
from
the
Antarctic
ice
core.
The
present
day
is
at
the
left-hand
end
and
the
right-hand
end
shows
the
last
interglacial
period
which
was
actually
warmer
than
the
present
day.
This
pattern
has
continued
for
the
last
few
million years and is likely to continue into the future.
When
all
the
component
waves
were
entered
into
a
computer
programme
to
reconstitute
the
resultant
graph,
a
very
good
match
was
achieved,
and
it
was
found
that
we
are
actually
at
the
very
end
of
the
present
inter-glacial
period
and
are
about
to
start
the
long
decent
into
the
next
ice
age.
However,
this
will
not
be
a
sudden
decent
(though
it
looks
quite
sudden
on
the
above
graph)
but
will
take several thousand years to get really cool.
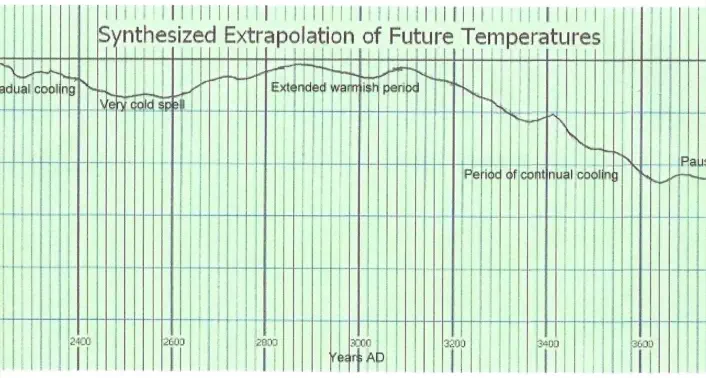
A
similar
analysis
was
done
on
a
smaller
time
scale
to
fill
in
the
shorter
term
changes
and
these
were
combined
with
the
larger
time
scale
results
to
se
what
is
likely
to
happen
over
the
next
two
thousand
years.
From
this
you
can
see
that
the
temperature
will
drop
for
about
the
next
500
years
and
then
rise
again
a
little
for
the
following
500
years
before
really
starting
to
descend
into
the
next
ice
age.
Even
then
there
are
prolonged
periods
with
no
change
and
even
periods
when
the
temperature
starts
to
rise
again.
You
can
see
from
the
curve
for
the
present
day
that
there
has
been
a
slight
rise
in
temperature
which
has
now
peaked
and
will
start
to
reduce
over
the
next
few
years.
Although
the
general
trend
is
down,
there
are
many
times
where
the
temperature
rises
again
for
a
short
while.
This is because some of the shorter-term cycles take priority for a while.
Plant Life
Plants
breathe
in
CO
2
,
and
give
off
oxygen,
while
all
animals
eat
plant
material
and
exhale
CO
2
.
This
is
the
natural
carbon
cycle.
The
more
animal
life
there
is,
the
more
CO
2
there
is,
which
is
good
for
the
plants
and
means
more
food
for
the
animals.
A
CO
2
level
of
200
ppm
is
about
the
minimum
level
that
will
sustain
plant
life
and
an
optimum
is
2000
ppm
.
This
is
what
is
fed
into
greenhouses
to
boost
plant
growth.
We
are
at
just
over
400
ppm
at
the
moment
and
could
actually
do
with
a
bit
more
CO2
to feed the growing population of the world.
Natural Disasters
There
have
always
been
floods,
storms,
famine,
wild-fires,
droughts,
heatwaves
and
very
cold
spells.
These
are
all
natural
quirks
of
the
weather.
The
media
now
latch
onto
any
such
occurrence
and
blame
global
warming.
In
fact,
if
you
study
the
records
going
back
hundreds,
or
even
thousands
of
years,
you
will
find
there
have
been
much
worse
events
in
the
past
and
that
there
is
no
sign
of
them
getting
worse.
Many
of
these
events
could
be
avoided
with
human
intervention.
Rivers
tend
to
silt
up
making
flooding
more
likely.
Dredging
might
help
here.
Clearing
much
of
the
flammable
undergrowth
could
reduce
the
extent
of
fires,
but
this
isn’t
done
as
conservationalists
say
it
will
disturb
the
wildlife.
Not
as
much
as
a
wild-fire,
I
would
have
thought.
Much
easier
to
blame
it
on
global warming.
Here
are
some
of
the
findings
and
technical
reports
made
by
independent
climate
scientists.
This
means
that
they
have
no
axe
to
grind
and
no
policy
mantra
to
follow.
If
you
have
any
articles
you
think might be of interest you can email them to me
here
.
Video pending
Science
Independent Climate Science